04Instruments
TLC View software
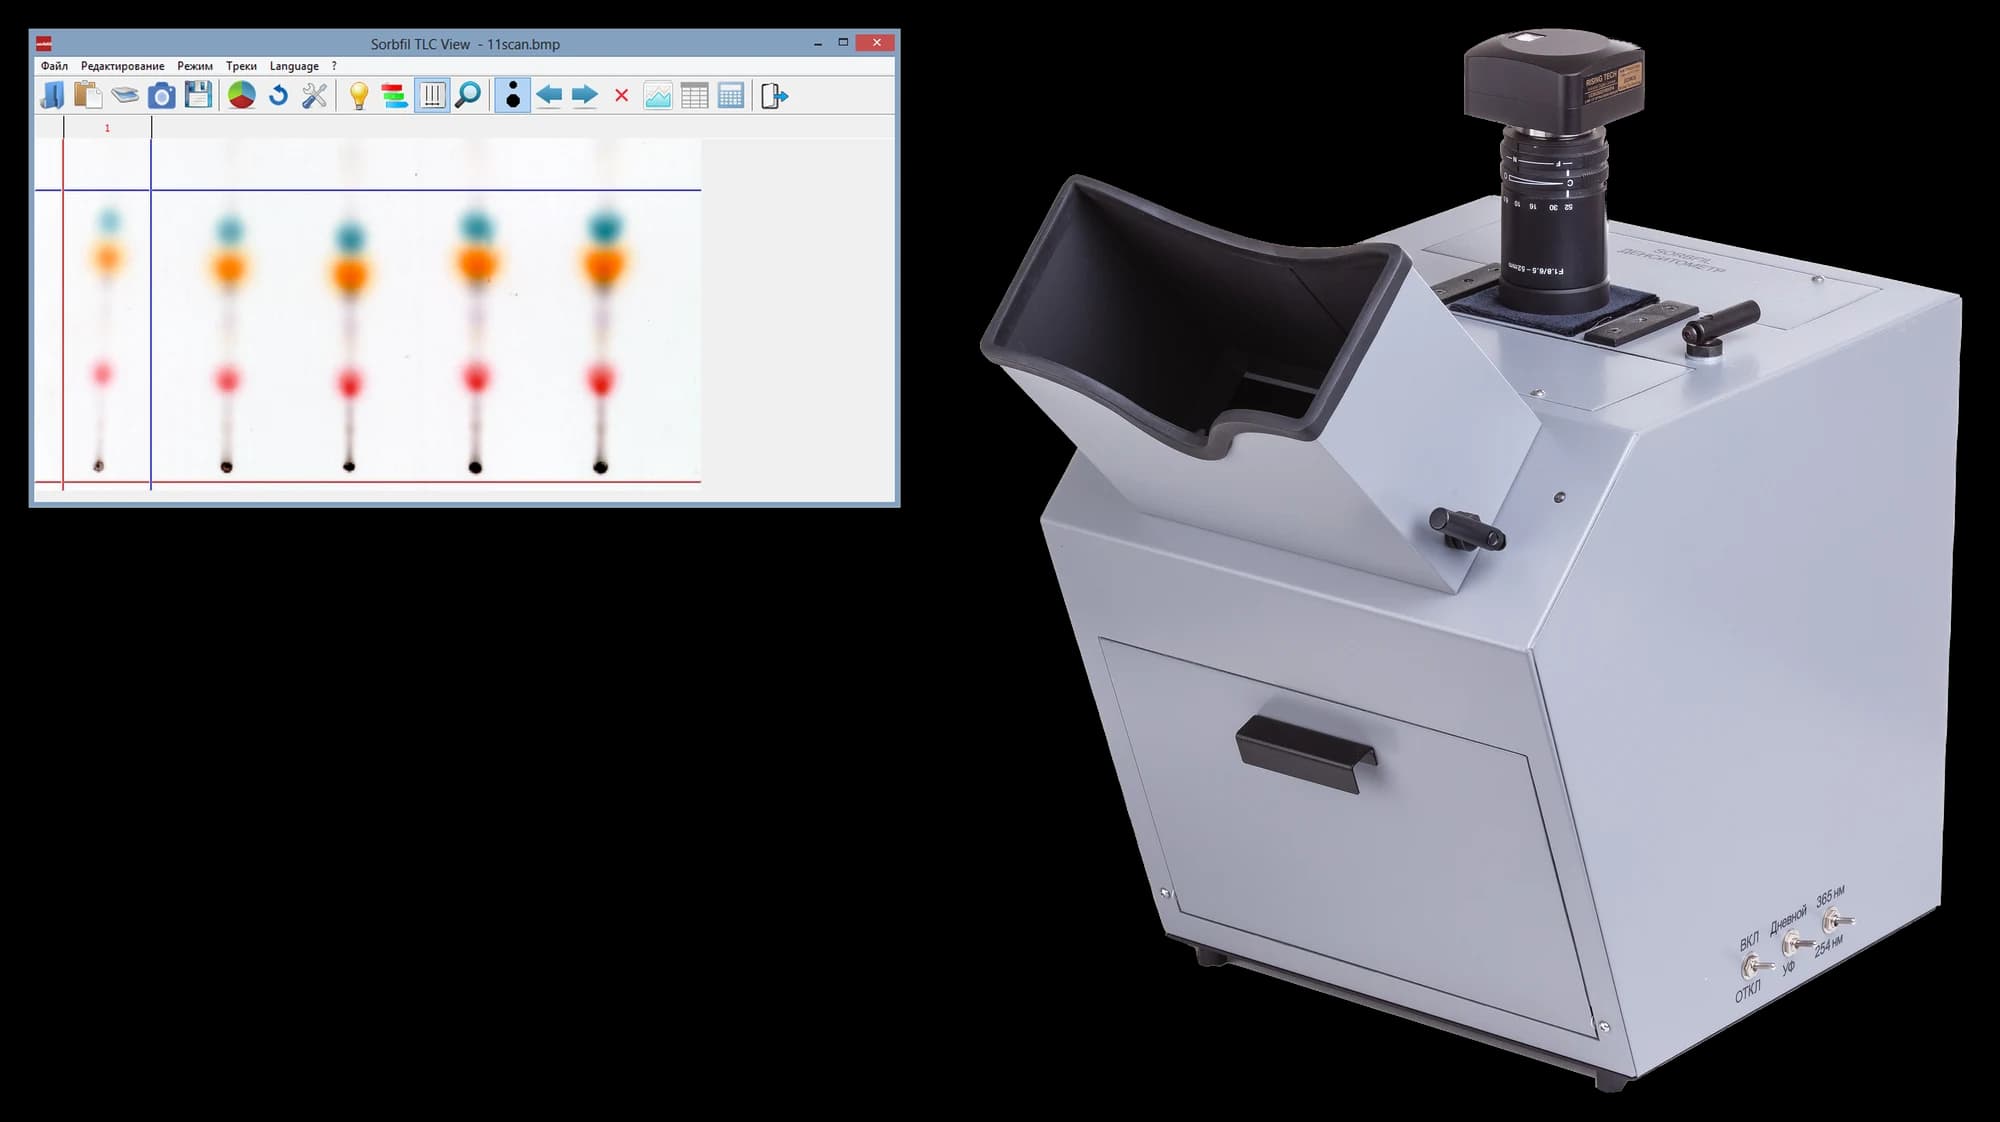
Sorbfil TLC View software
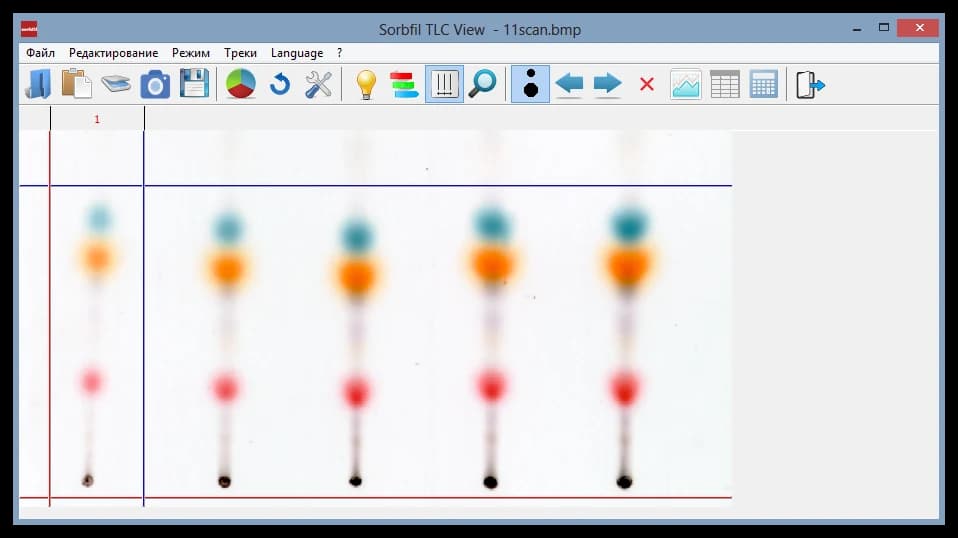
- 01Track boundaries
- 02Solvent-front line
- 03Start line
Quantitative chromatogram processing software for the Sorbfil visualiser and densitometers. From the plate image it builds a densitogram for every track, finds the peaks and reports Rf, peak areas and heights, mixture composition in per cent and analyte concentration in a sample from a calibration curve.
- Rf, peak areas and heights
- Concentration from a calibration curve
- Input from a camera, a scanner or a file
- Printable calculation report
§ A — DESCRIPTION
Description
Sorbfil TLC View runs the visualiser and both Sorbfil densitometers — the light-cabinet and the flatbed-scanner one. The instrument sends the plate image to the computer, where the software stores and processes it. An image can also be opened from a file or pasted from the clipboard.
How it calculates. For every track the software builds a densitogram — the deviation of spot brightness from the plate background — finds the peaks on it and computes their area. The model assumes that the size and brightness of a spot relative to the background are proportional to the amount of substance in it.
Two quantitative calculations:
- mixture composition — approximate content in per cent by simple normalisation: each peak's share of the total peak area in the track;
- analyte concentration in a sample — by absolute calibration (external standard): the standards' spots give a calibration curve of amount against peak area, linear or quadratic, and the sample is read off it, taking into account the sample mass or volume, the extract volume and the aliquot. The result is reported in mg/kg or mg/L.
Workflow:
- image capture — from the video camera as a series of frames (typically 10–16) averaged into one, from a scanner or from a file;
- marking up — start and front lines; tracks by hand, automatically within a selected area, as a regular grid or from a saved layout; a skewed image can be straightened so that Rf comes out right;
- track calculation — Rf, spot travel, peak area and height and their shares, number of theoretical plates, peak asymmetry; peak boundaries and apex can be adjusted by hand, the sensitivity threshold and smoothing tuned;
- colour-composition analysis and colour correction of the image — raise spot contrast and help separate merged spots;
- report — results are compiled into a printable report, and tables go through the clipboard to, for example, Excel.
The spot the software "sees" is about twice as wide as the one the eye sees, so a track is set about two diameters of its largest spot wide. Worth keeping in mind at the application stage: tracks applied too close together merge and the calculation loses accuracy.
Stored chromatograms stay available for re-calculation at any time. To rule out any change to an image, save it as a "closed BMP".
§ D — RELATED ITEMS
What else to look at
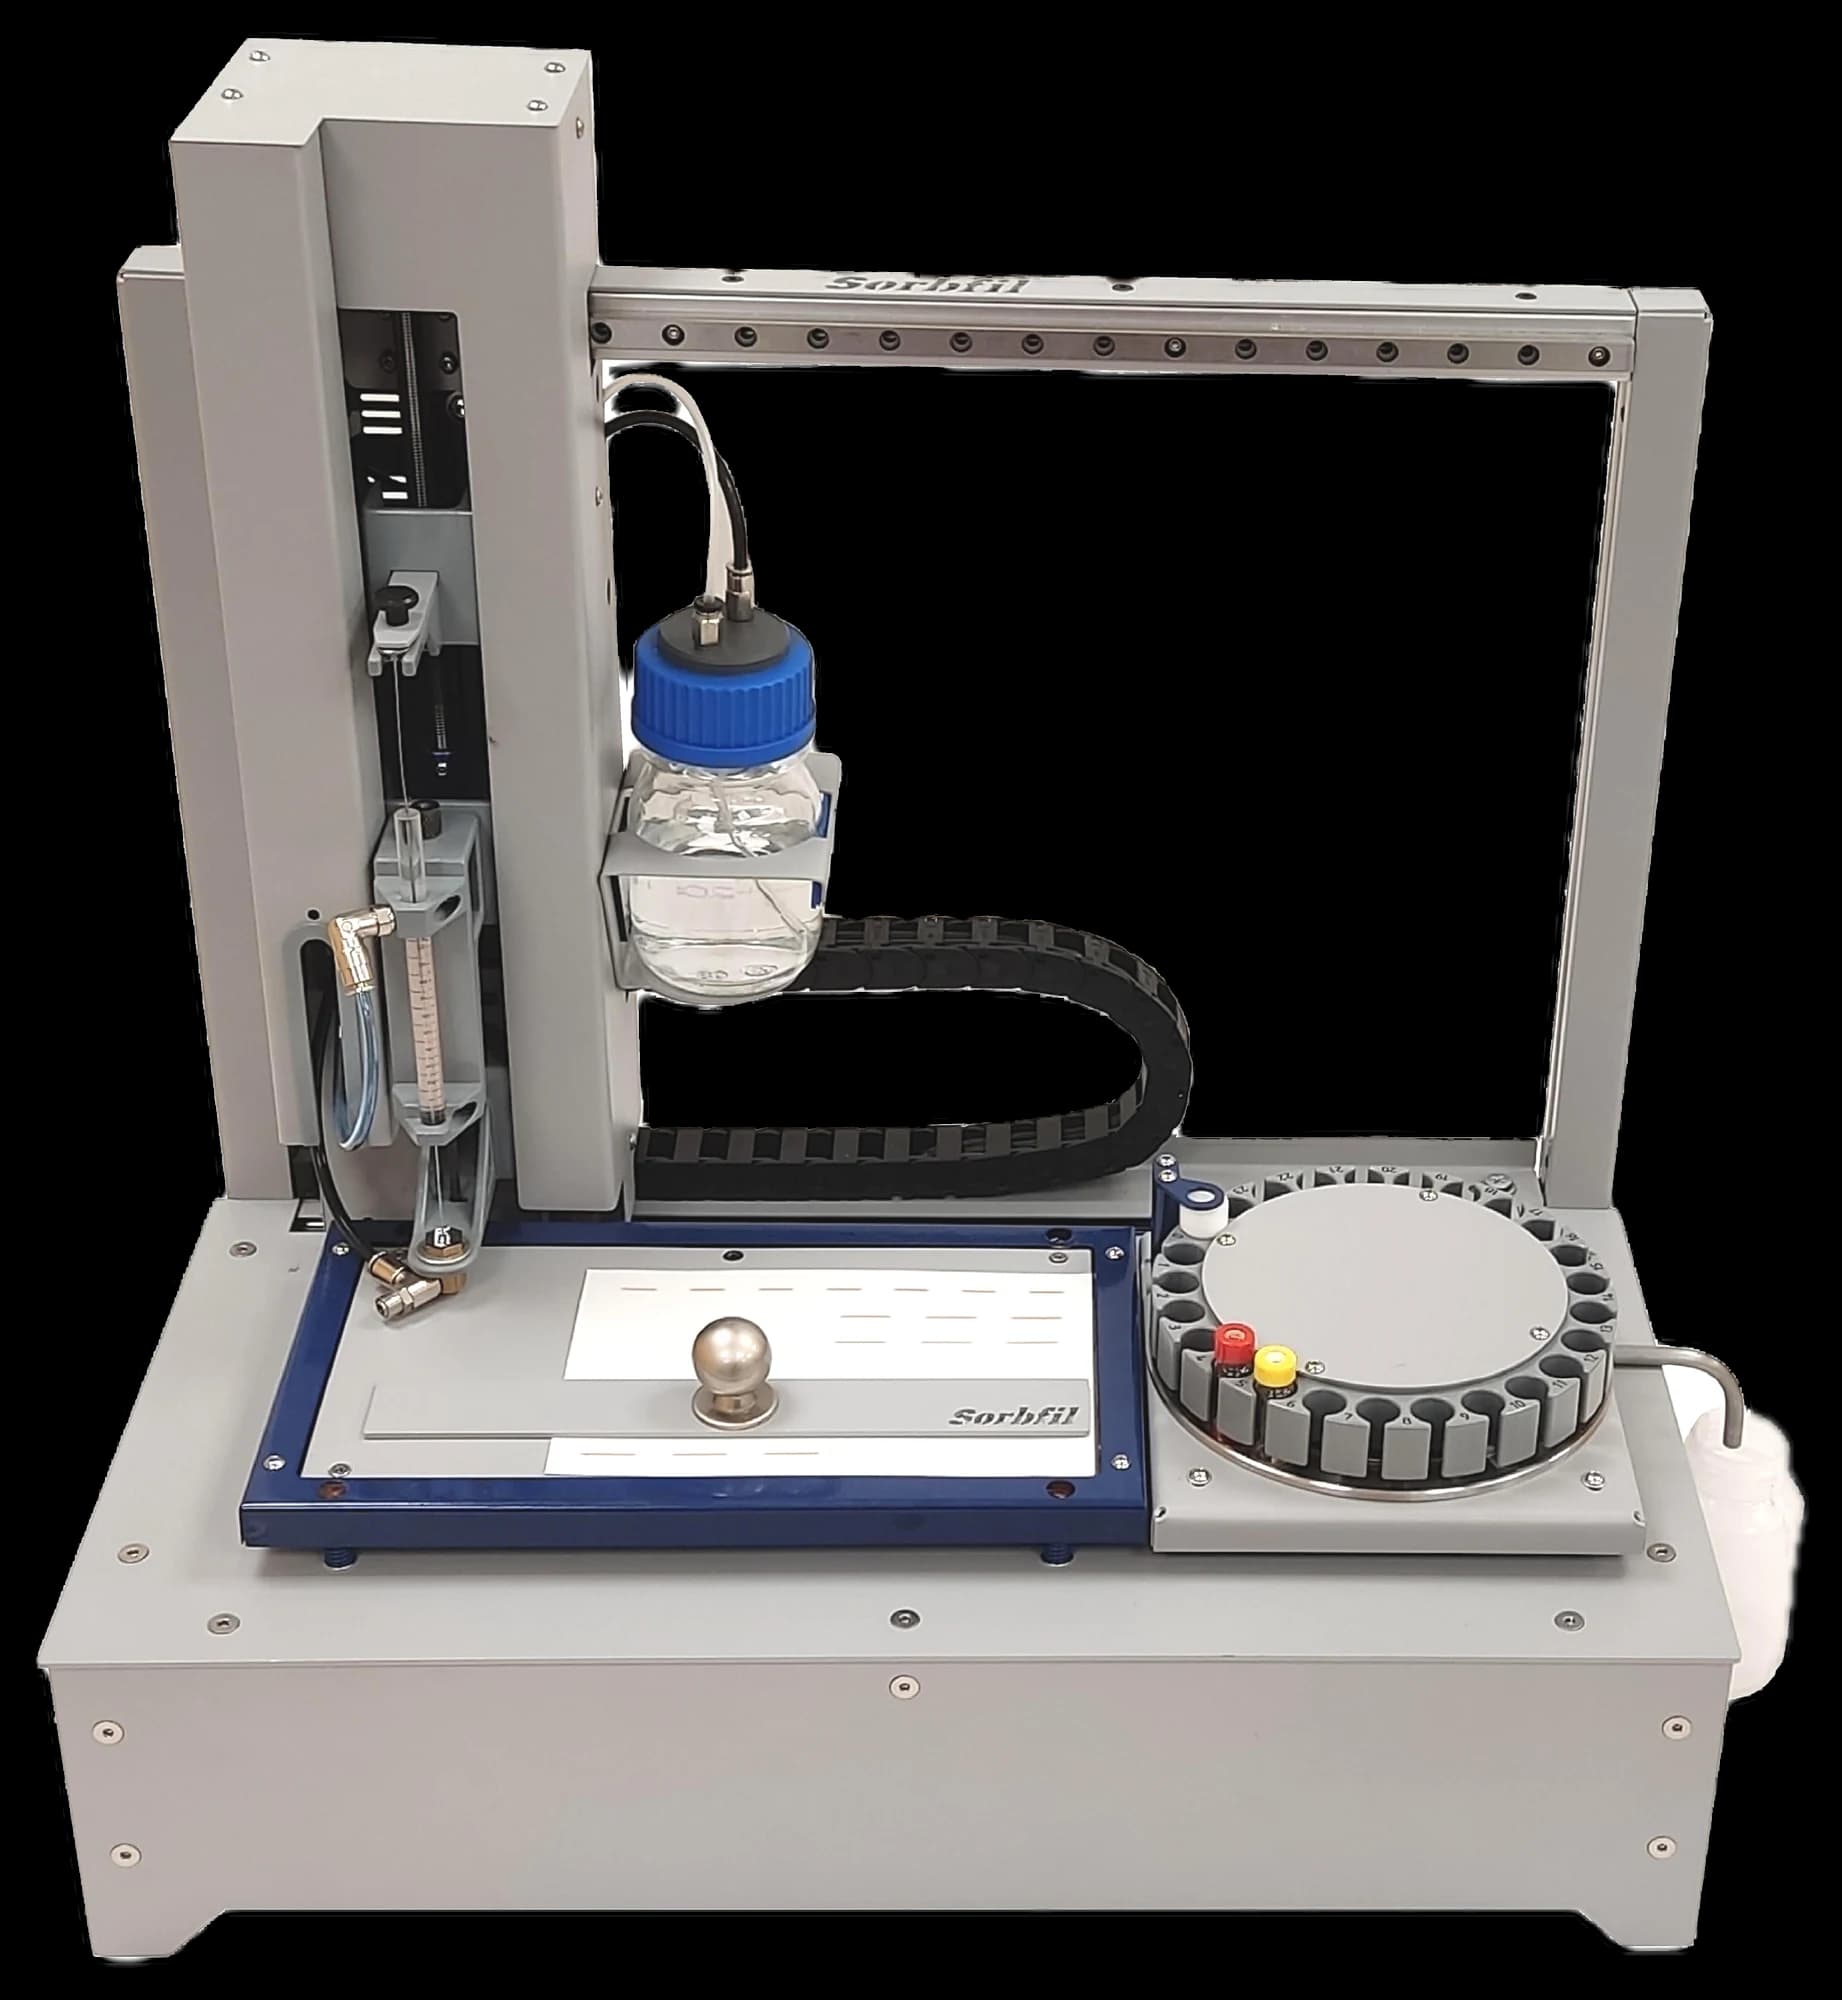
Auto applicator
- ТУ
- ТУ 4215-022-16943778-2022
- Key
- Automated sample application
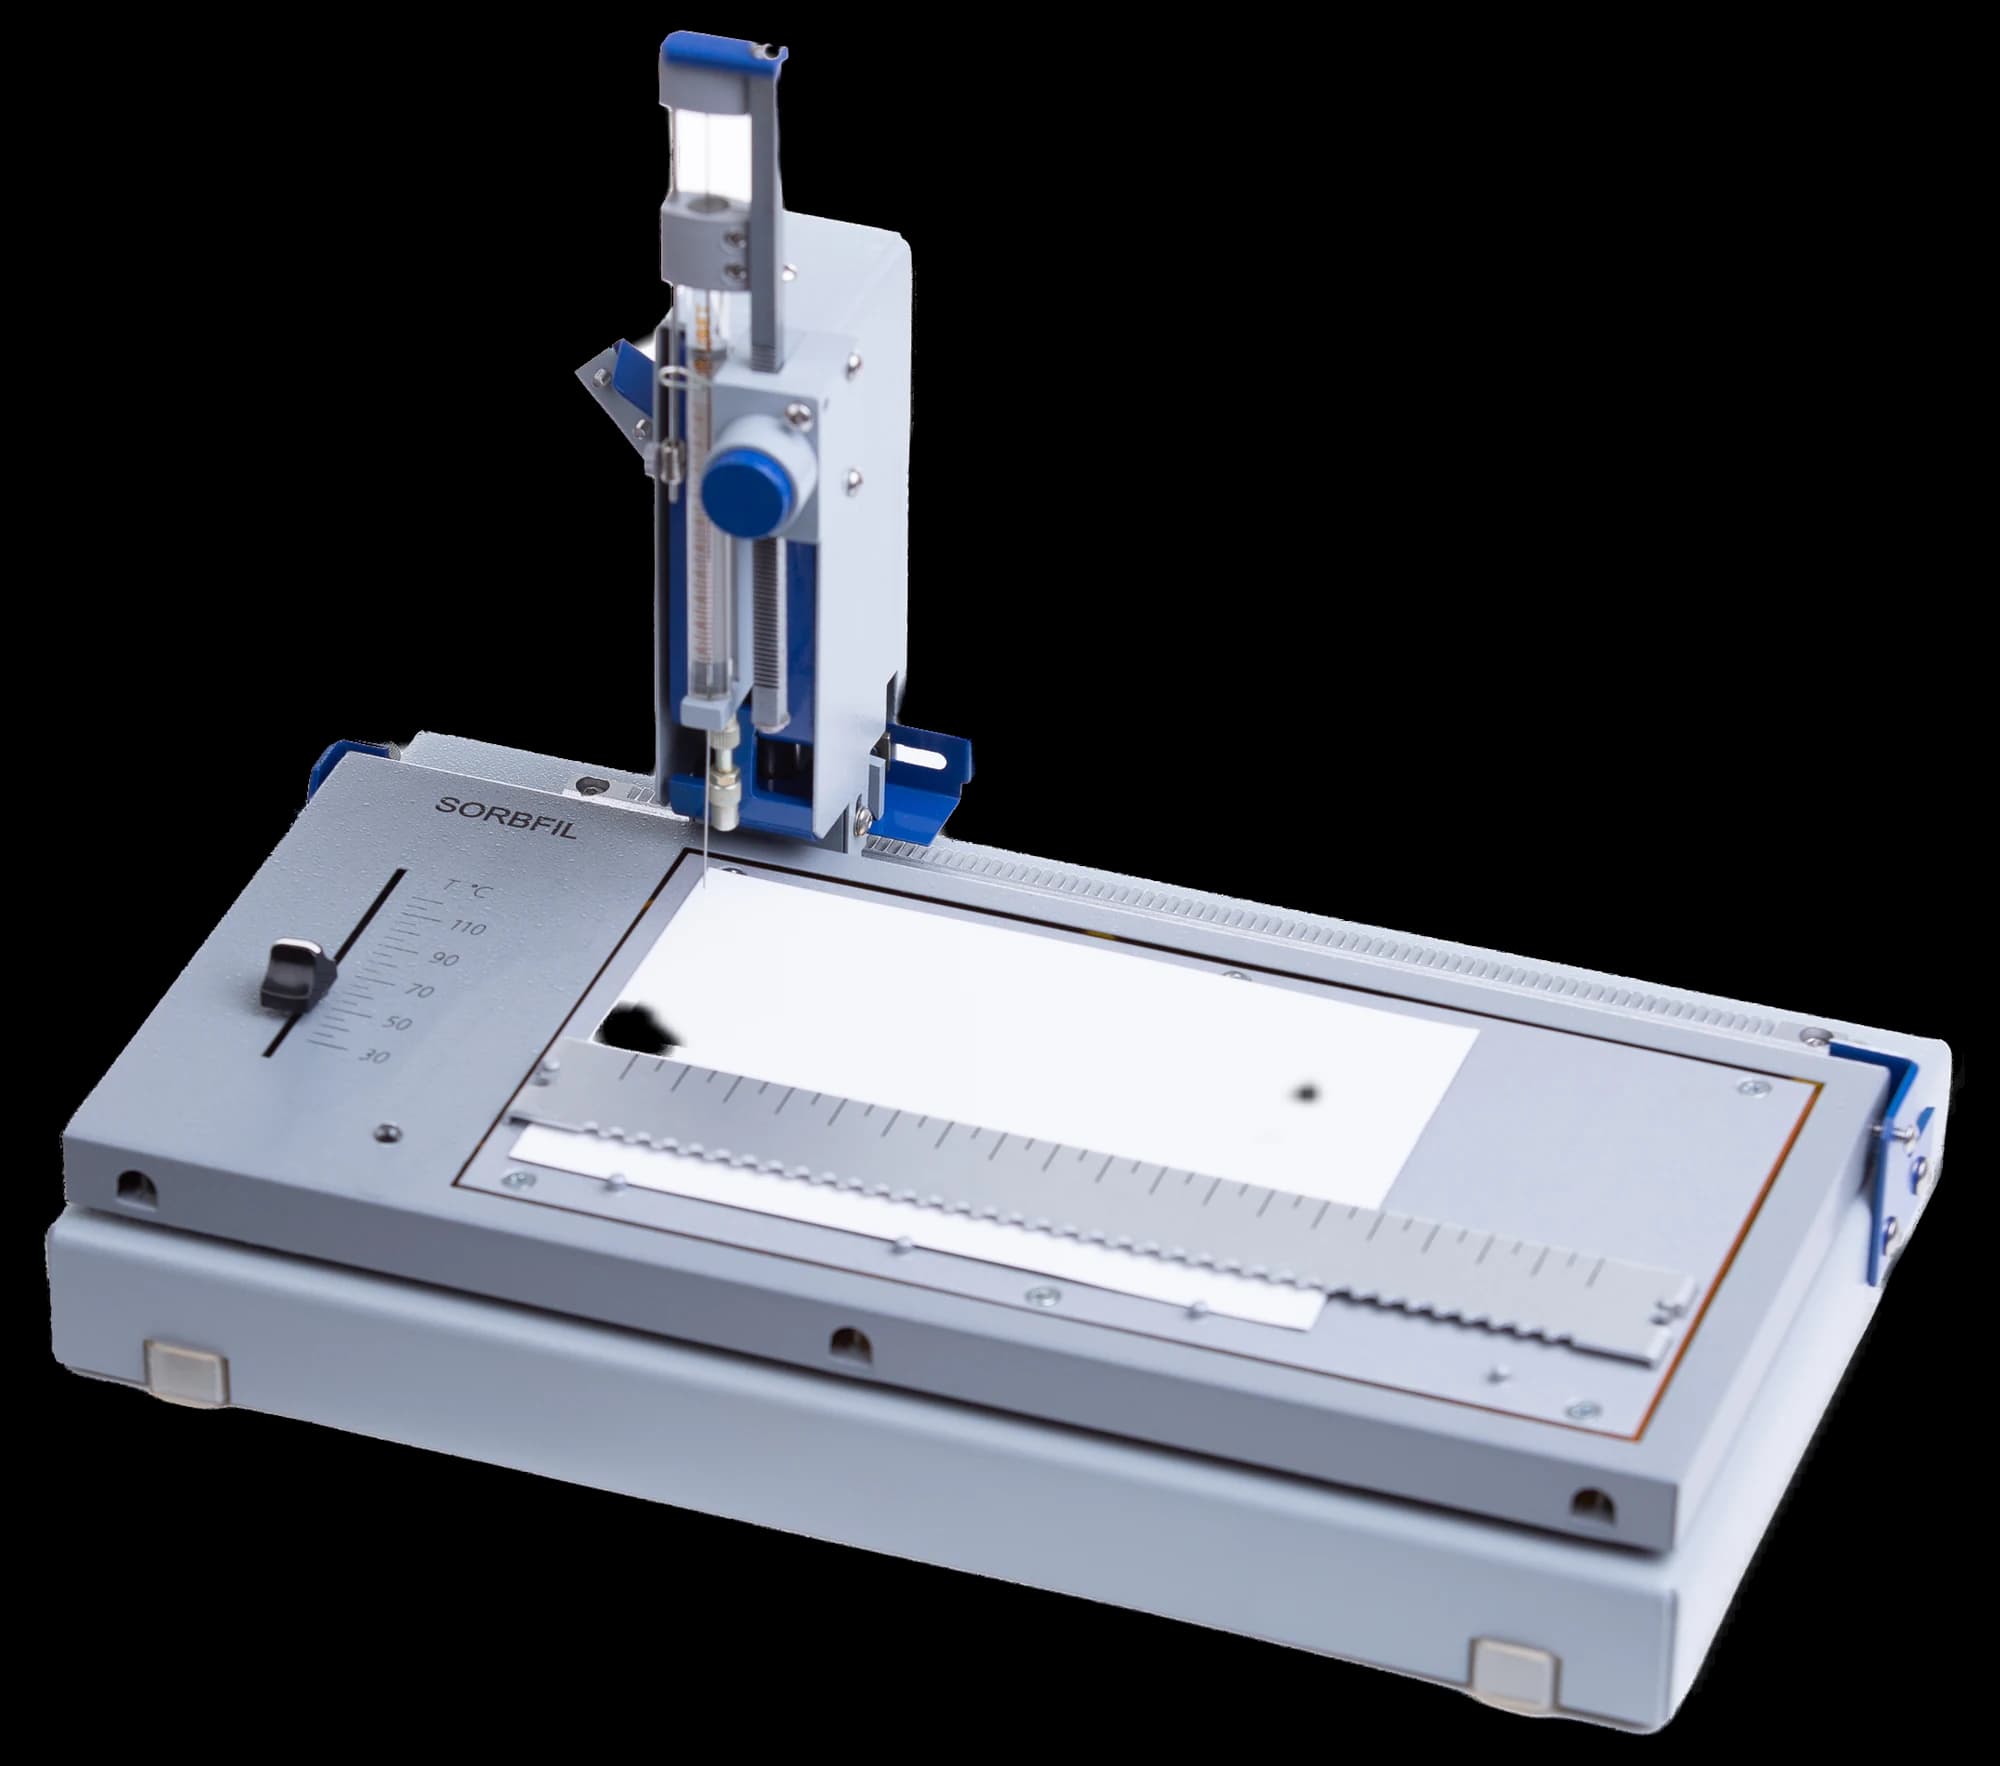
Manual applicator
- ТУ
- ТУ 4215-003-43636866-2007
- Key
- Metered manual application
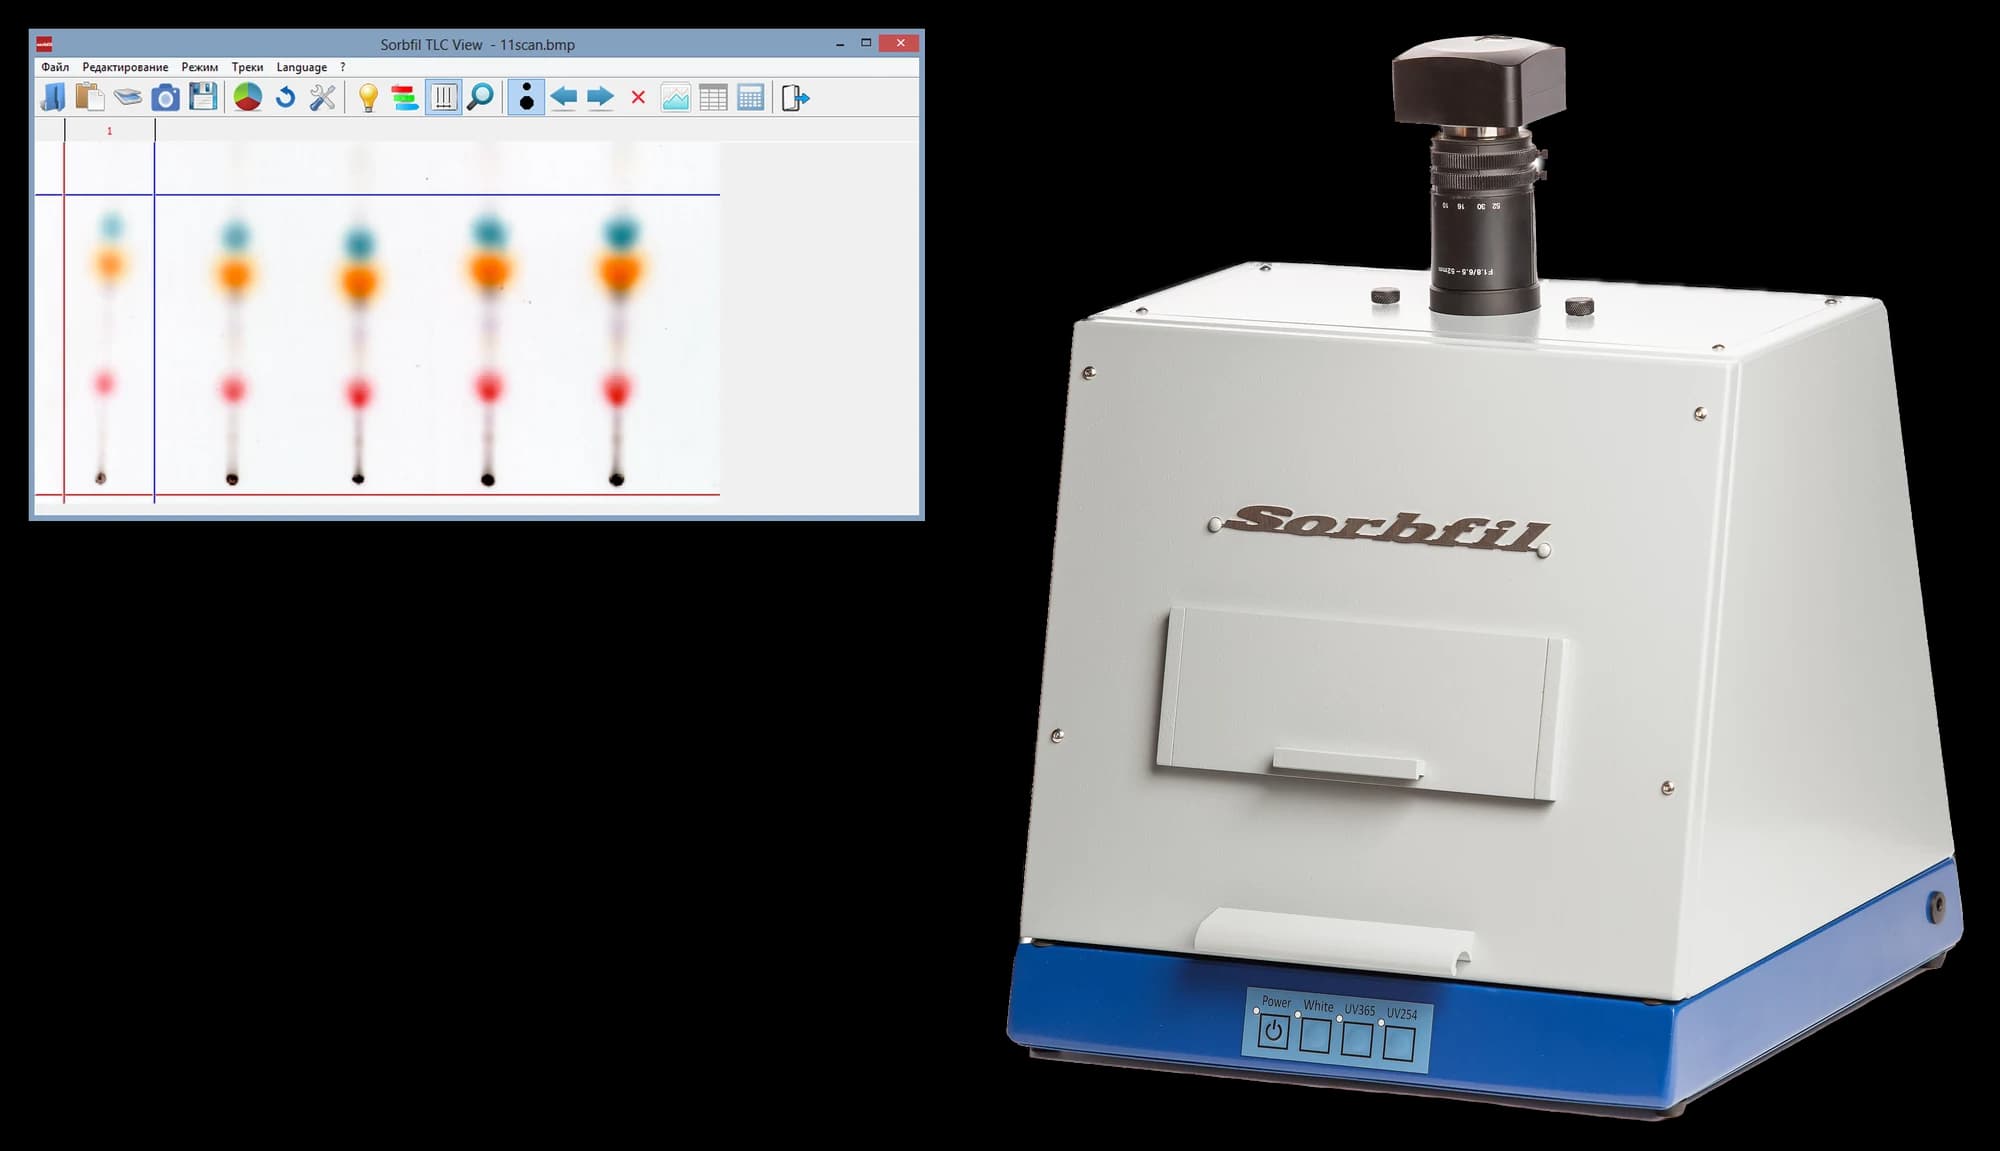
Sorbfil visualiser
- ТУ
- ТУ 4215-016-43636866-2015
- Key
- Daylight, 254 nm and 365 nm UV
Light-cabinet densitometer
- ГР СИ
- ГР СИ № 23965-08
- ТУ
- ТУ 4436-017-43636866-2007
- Key
- Daylight + 254/365 nm UV
HOW TO ORDER
Three stepsto invoice
Message the manager with the items and quantities you need, and you’ll receive an invoice within 1–3 business days.
Pick the items
Open the catalog and identify the specific items: plate type, size, layer thickness.
Message the manager
Send a message or an e-mail — whichever works for you. Include the item (name or ТУ) and quantity; the manager will follow up with any clarifications.
- Message
- +7 (928) 431-68-88
- info@sorbfil.com
Receive an invoice
The manager will send an invoice with banking details, shipping timeline, and delivery terms.
1–3 business days
Prices are quoted individually for tenders and bulk orders. Item descriptions and ТУ numbers are in the Catalog.